 |
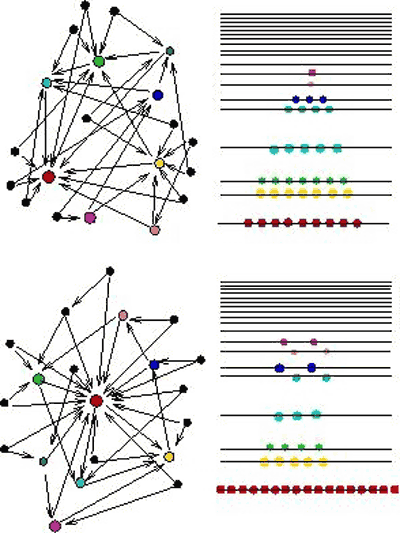
| Description: The colored dots on the diagrams on the left represent network nodes and the lines the links between them. The horizontal lines on the graphs on the right represent energy levels of atoms in a gas. The number of links between nodes at various stages of network maturity corresponds to the number of atoms at specific energy levels in a gas at different temperatures. The top gas diagram shows the gas beginning to condense, and the bottom diagram a condensed gas. |
| Source: University of Notre Dame |
| Story: Nets
mimic quantum physics TRN August 22/29, 2001 |
| TRN Categories: Applied Computing; Networking |
| Form: Still |
|
TRN
Newswire and Headline Feeds for Web sites
|
© Copyright Technology Research News, LLC 2000-2008. All rights reserved.