Tools cut data down to size
By Kimberly Patch, Technology Research NewsHumans quickly recognize objects despite the many combinations of angle and lighting changes that make nothing look exactly the same from one moment to the next.
The key to this recognition is our instinctive ability to quickly determine which of the objects' many traits, or data points to pay attention to. What it really comes down to is a lifelong version of the old Sesame Street game One of These Things Is Not like the Other.
Getting a computer to glean the traits needed to determine that two views of the same face are just that is actually a difficult problem involving a lot of higher math. Its solution also has many potential uses.
Gaining this ability would help computers interact with their environments by better understanding spoken speech, deciphering handwriting and recognizing faces. It would also make it easier to extract information from large databases and sort noise from data in audio and video applications.
Two research teams are pushing the field forward with algorithms that reduce the dimensionality of nonlinear data.
Linear data can be represented algebraically in steps that come one after another. Classic data algorithms like principal complement analysis (PCA) and multidimensional scaling (MDS) have been used for years to reduce the dimensionality of linear data. As it turns out, however, relationships in real-world data are usually nonlinear, involving things like loops.
Dimensionality refers to the number of measurements available for each item in a data set, according to Sam Roweis, a senior research fellow at University College London's Gatsby Computational Neuroscience Unit. A set of data that has just two dimensions can be plotted on a flat graph, while data with three dimensions can be plotted on a graph with x,y and z axes. The dimensionality of real world items, however, is inevitably much higher than can be pictured using the three dimensions we can see.
"For example, if you have a bunch of 600 by 600 images, their dimensionality is 360,000 since that is how many pixels each one has," Roweis said. Similarly, the dimensionality of data measuring the frequency of a group of words across a number of documents equals the number of documents.
The key to analyzing data is comparing these measurements to find relationships among this plethora of data points.
In nonlinear data these measurements are highly redundant, and relationships among data points predictable, said Roweis. "If I tell you the value of a pixel in an image it is easy to predict the values of nearby pixels since they tend to be similar. Or if I tell you that the word 'corporation' occurs often in articles about economics, employment and environment but not very often in articles about art, poetry and classical music then it is easy to predict that it will not occur very often in articles about love," he said.
Although there are lots of measurements per item, there are far fewer that are likely to vary. Using a data set that only includes the items likely to vary allows humans to quickly and easily recognize changes in high dimensionality data.
These measurements that are likely to vary are referred to as 'degrees of freedom.' Noticing how things like lighting, pose and expression change a person's face across all 360,000 pixels of a picture is both tedious and unnecessary when the face really only has 30 degrees of freedom. "The difference between 30 and [360,000] is what makes data like pictures of faces amenable to dimensionality reduction," said Roweis.
The research teams have each written algorithms that winnow out relationships between data points that, for instance, mean the difference between a face looking up and a face looking down.
The trick is not only finding the important relationships, but preserving those relationships in a lower dimensionality space that is easier to picture and work with. "What's meaningful isn't the property of any one pixel, it is somehow a merged property of the whole object," said Josh Tenenbaum, an assistant professor of psychology and computer science at Stanford University.
Astronomy data, for example, includes the amount and wavelengths of light stars emit. This constitutes a huge body of data because there many stars, wavelengths and amounts. "You detect maybe 1,000 different wavelengths of light just in a regular optical telescope," said Tenenbaum. The underlying parameters that astronomers are interested in is a much smaller data set that can be deduced from this data, like an individual star's gravity, temperature and the amount of metal it contains.
The trouble is, gravity, temperature and metal content may not be related in a simple way to the amount of light reflected or coming out of any one wavelength. "You want to find a few meaningful dimensions that are somehow hidden in this high dimensional mess," said Tenenbaum.
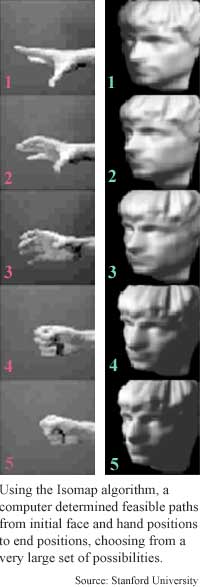
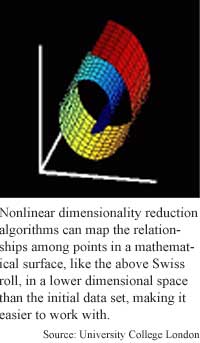
Tenenbaum's Isomap algorithm extracts meaningful dimensions by measuring the distance between data points in the geometric shapes formed by items in a nonlinear data set. "Our technique works by [measuring] the intrinsic geometry of the surface. That's captured... by the distances between points along the surface," he said. This would be fairly easy using linear data, which can be represented mathematically as a group of planes in a space. Nonlinear data, however is represented by more complicated shapes. The class of shapes Tenenbaum's algorithm works best for are shapes that can be flattened out, like cylinders or Swiss rolls.
For data that maps mathematically to a roll shape, for instance, Tenenbaum's algorithm measures the distance between any two points on the shape, then uses these geodesic distances in combination with the classic multidimensional scaling algorithm in order to make a low dimensional representation of that data.
Roweis' Local Linear Embedding (LLE) algorithm works a little differently. It figures out how each item in a data set is related to the few items nearest to it. It then preserves these neighborhood relationships when the data is converted from its high dimensional form into a low dimensional form.
"Making a low dimensional form of data whose mathematical shape in high dimensional space is a sphere, for instance, is like making a flat wall map of the earth," said Roweis. "We need to preserve the local relationships between places, and this involves a bit of distortion since we have to flatten... the globe. But if we do the flattening over small areas it is not so bad since the earth is not curved too much over short distances."
The LLE algorithm chops the sphere into small patches that each do not involve a lot of curve. "Once we flattened each small patch we can reassemble patches in a lower dimensional space, but still trying to preserve the relative positions of things within each patch," Roweis said.
Neither technique is perfect -- they both introduce some distortions of the data, especially for more complicated shapes that include curves. The different approaches may prove to be better or worse for different types of data, said Tenenbaum. "Our approach, based on estimating and preserving global geometry, may distort the local structure of the data. Their technique, based only on local geometry, may distort the global structure," he said.
The techniques are "an important, useful advance in pattern recognition," said Javier Pena, an assistant professor of operations research at Carnegie Mellon University. "It is commonplace to have huge databases of information in a variety of contexts. The described techniques attempt to... filter the essence of what these huge databases contain," he said.
Roweis is working on taking the LLE algorithm a step further by mapping the difference between the original data space and the low dimensionality set. This mapping could be used to find the low dimensionality data for new data items, to interpolate, or morph new data items between existing items and to extrapolate new data beyond the range of the original data set, according to Roweis.
The Isomap researchers are looking to extend their algorithm to data sets that have intrinsic curvature, to make it work with data sets that have a lot of noise and to make it run faster with data sets that have one million points or more, said Tenenbaum. They are also working with scientists who are using the algorithm on real-world data to see what types of data the algorithm is useful for, Tenenbaum said.
This includes a collaboration with mathematicians who deal with the topology of shapes. "There's a whole bunch of different mathematical properties of surfaces... topology like holes and connectedness properties. These are all things mathematicians have studied on abstract surfaces for... at least a century. What we're trying to do here is to study the [mathematical] surfaces that live in real-world data -- there's a lot of open questions like what really are the important geometric and topological features of the surfaces, said Tenenbaum.
Roweis' research colleague was Lawrence K. Saul of AT&T Research. The research was funded by AT&T, the Gatsby Charitable Trust, the National Science Foundation (NSF) and the Canadian Natural Sciences and Engineering Research Council (NSERC).
Tenenbaum's research colleagues were Vin de Silva of Stanford University and John C. Langford of Carnegie Mellon University. The research was funded by Mitsubishi, the Schlumberger Foundation the National Science Foundation (NSF) and the Defense Advanced Research Projects Association (DARPA).
Both groups published the results in the December 22, 2000 issue of Science.
Timeline: < 2 years
Funding: Corporate, Government, Private
TRN Categories: Pattern Recognition
Story Type: News
Related Elements: Technical papers, "Nonlinear Dimensionality Reduction by Locally Linear Embedding," and "A Global Geometric Framework for Nonlinear Dimensionality Reduction," Science, December 22, 2000. Download of the Isomap algorithm: isomap.stanford.edu
Advertisements:
March 14, 2001
Page One
Tools cut data down to size
Ribbons expand nanotech toolbox
Silicon cages metal atoms
Surfaces channel liquids
Chip impurities make quantum bits
News:
Research News Roundup
Research Watch blog
Features:
View from the High Ground Q&A
How It Works
RSS Feeds:
News
Ad links:
Buy an ad link
| Advertisements:
|
 |
Ad links: Clear History
Buy an ad link
|
TRN
Newswire and Headline Feeds for Web sites
|
© Copyright Technology Research News, LLC 2000-2006. All rights reserved.